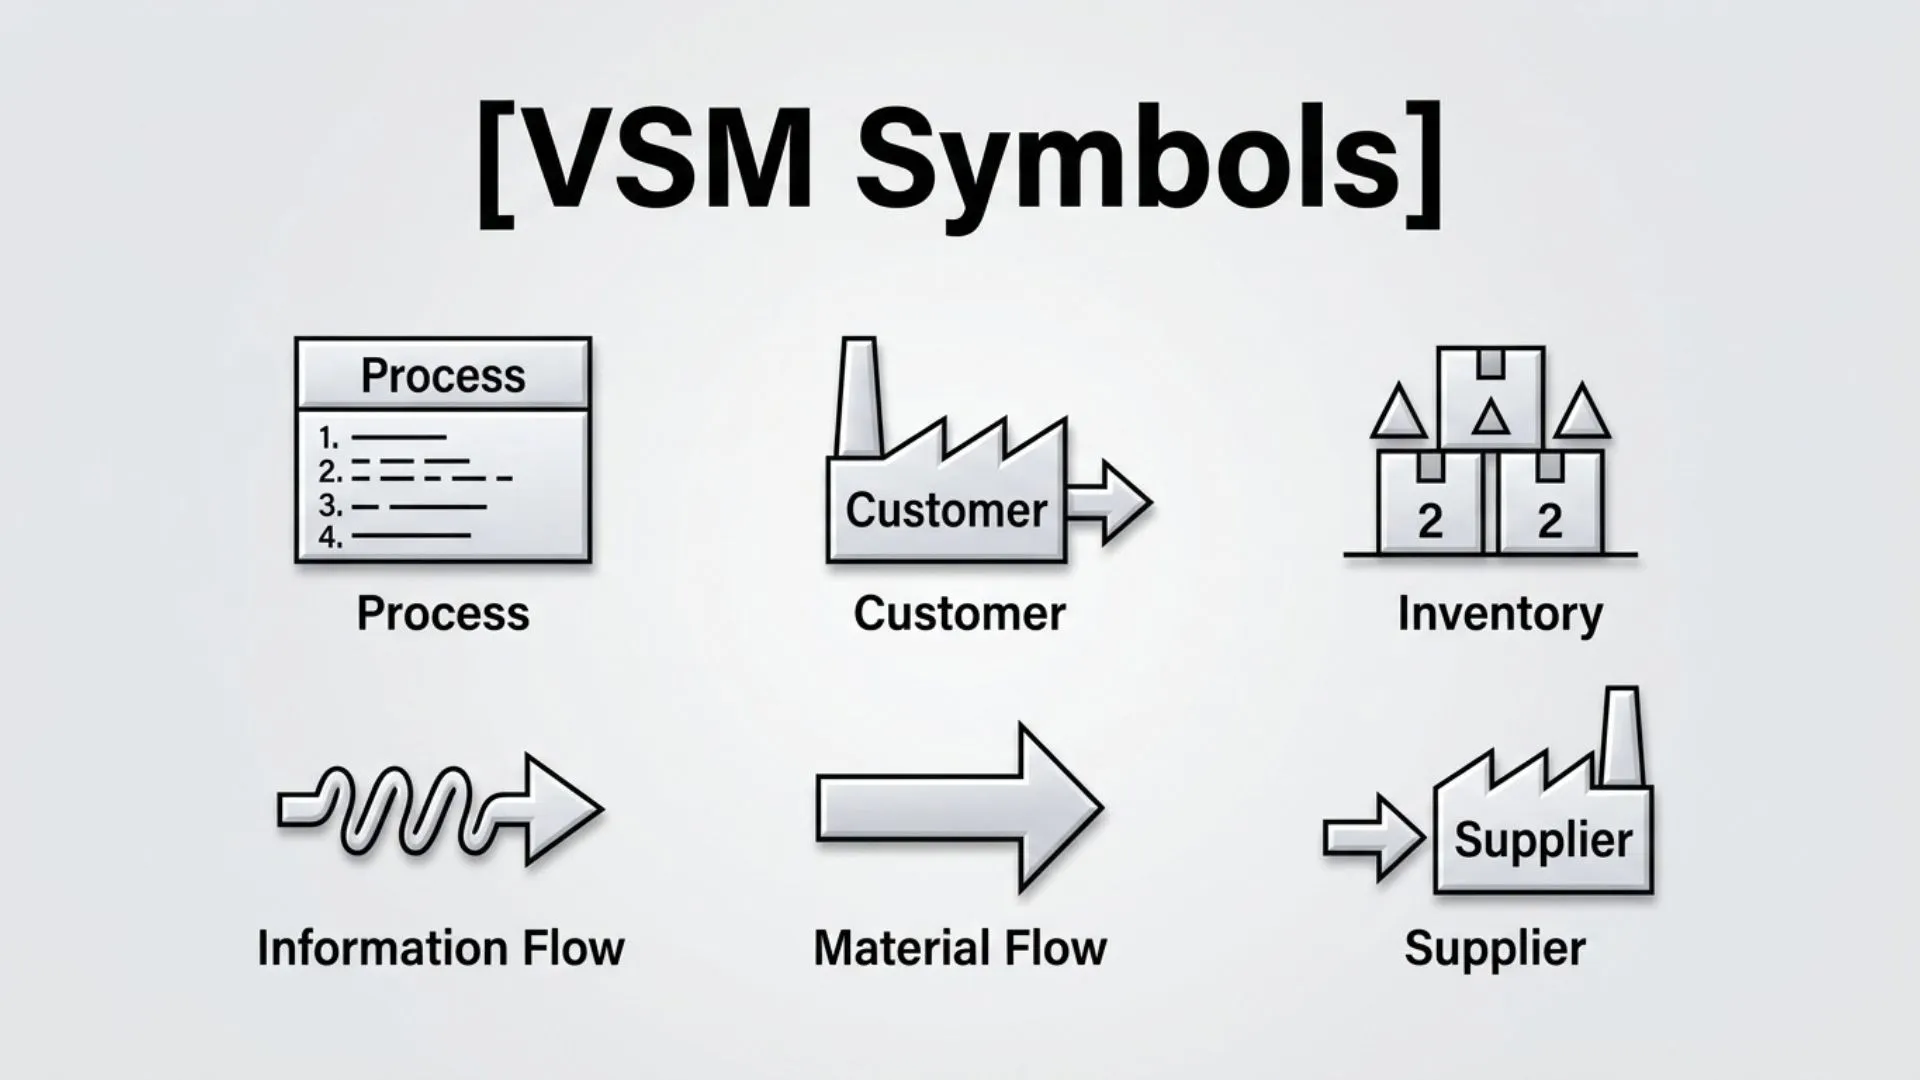
Value Stream Mapping (VSM) is one of the most effective tools used in Lean manufacturing and business process improvement. It provides a visual representation of how materials and information flow through a process, helping organizations identify waste, reduce delays, and improve efficiency. At the heart of every value stream map are VSM symbols standardized icons that represent processes, inventory, transportation, customers, suppliers, data, and communication.
Understanding VSM symbols is essential for engineers, manufacturers, project managers, quality professionals, and business analysts. These symbols create a common language that allows teams to document complex workflows quickly and accurately. Instead of lengthy explanations, each symbol communicates a specific function, making value stream maps easier to read and analyze.
This comprehensive guide explains the meaning of VSM symbols, their history, major categories, practical applications, best practices, and common mistakes. Whether you’re new to Lean principles or looking to improve your process mapping skills, this article provides everything you need to understand and use VSM symbols effectively.
VSM Symbols (Meaning and Overview)
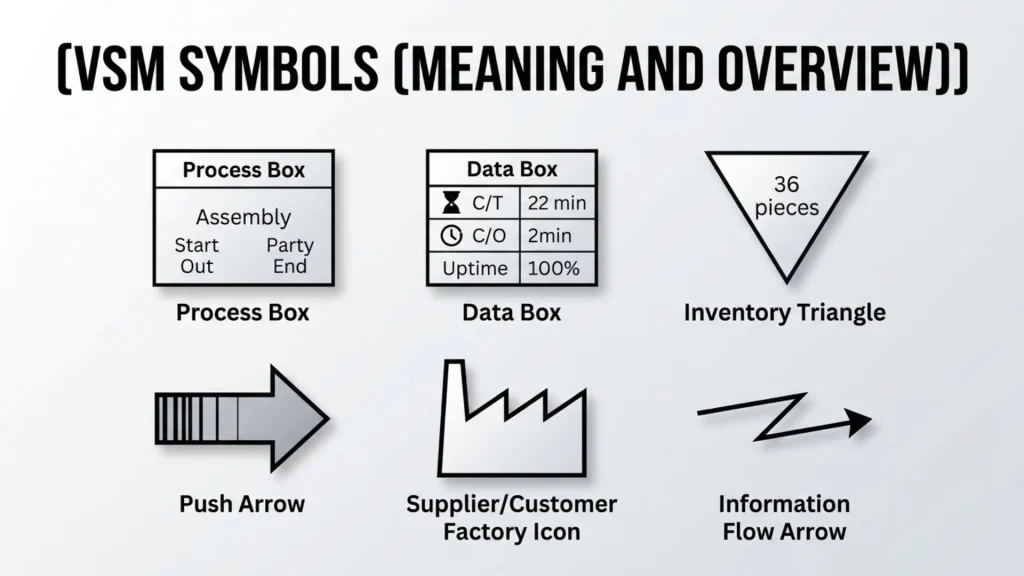
VSM symbols are standardized graphical icons used to create value stream maps. These maps illustrate every step involved in delivering a product or service, from suppliers to customers, while highlighting both material flow and information flow.
Each symbol has a specific meaning. Together, they provide a visual representation of an organization’s current process and help teams design an improved future-state workflow.
Unlike decorative symbols or typography characters, VSM symbols serve as functional communication symbols. Their purpose is to simplify complex business processes into an easy-to-understand diagram.
Common elements represented by VSM symbols include:
- Customers
- Suppliers
- Manufacturing processes
- Inventory
- Transportation
- Data collection
- Information flow
- Scheduling
- Production control
- Material movement
Because these symbols follow Lean methodology, they are recognized by professionals around the world.
History and Origin
Value Stream Mapping originated from the Toyota Production System (TPS), developed in Japan after World War II. Toyota engineers sought a better way to visualize manufacturing processes, eliminate waste, and improve production efficiency.
Although process flow diagrams already existed, Toyota expanded the concept by incorporating both material movement and information flow into a single visual system.
As Lean manufacturing gained popularity during the 1980s and 1990s, companies worldwide adopted Value Stream Mapping. Standardized VSM symbols became an essential part of Lean implementation because they ensured consistency across industries.
Today, VSM is widely used not only in manufacturing but also in healthcare, software development, logistics, government, finance, and service organizations.
Types, Variations, or Categories
VSM symbols are generally grouped into several categories based on their purpose.
Process Symbols
These symbols represent activities that transform materials or information.
Examples include:
- Process box
- Shared process
- Work cell
- Operator symbol
They show where work is performed and where value is added.
Material Flow Symbols
Material flow symbols illustrate how products move through the production process.
These include:
- Inventory
- Shipment
- Truck transportation
- Forklift movement
- Finished goods
Material flow is usually represented with solid arrows.
Information Flow Symbols
Information flow symbols show how production instructions move between departments.
Examples include:
- Electronic information
- Manual information
- Production schedule
- Kanban signals
These symbols highlight communication systems supporting production.
Common VSM Symbols and Their Meanings
Learning the most common VSM symbols is the first step toward creating effective value stream maps.
Customer and Supplier Symbol
This symbol represents either the customer receiving products or the supplier providing raw materials.
It usually appears at opposite ends of the map:
- Supplier on the left
- Customer on the right
It defines the boundaries of the value stream.
Process Box
The process box is one of the most important VSM symbols.
It represents:
- Manufacturing operation
- Service activity
- Assembly process
- Inspection step
Each process box typically includes performance data such as:
- Cycle time
- Changeover time
- Uptime
- Number of operators
Data Box
Located beneath the process box, the data box contains operational information.
Typical metrics include:
- Cycle time (CT)
- Lead time (LT)
- Uptime percentage
- Batch size
- Available working time
This information supports process analysis.
Inventory Symbol
The inventory symbol appears as a triangle.
It indicates stored materials waiting between production stages.
Excess inventory often reveals opportunities for Lean improvement.
Shipment Symbol
A truck icon represents incoming or outgoing shipments.
It illustrates transportation between suppliers, manufacturers, warehouses, and customers.
Push Arrow
A solid arrow indicates material is pushed from one process to another.
Push systems produce items according to schedules rather than actual customer demand.
Pull Arrow
Pull arrows indicate production based on downstream demand.
Pull systems help reduce excess inventory and improve responsiveness.
Electronic Information Flow
A lightning bolt or zigzag arrow represents electronic communication.
Examples include:
- ERP systems
- Production software
- Digital scheduling
Manual Information Flow
Straight arrows indicate manual communication.
This may include:
- Phone calls
- Printed schedules
- Verbal instructions
- Paper documentation
Production Control Symbol
This symbol represents the department responsible for scheduling production.
It coordinates:
- Customer orders
- Supplier deliveries
- Manufacturing schedules
Production control plays a central role in Lean systems.
Kanban Symbol
Kanban symbols represent visual production signals.
They support pull production by authorizing replenishment only when needed.
Several Kanban variations exist, including:
- Withdrawal Kanban
- Production Kanban
- Signal Kanban
Supermarket Symbol
A supermarket symbol represents controlled inventory storage.
Instead of unlimited stock, inventory is replenished based on customer demand.
Supermarkets improve material flow while reducing waste.
FIFO Lane
FIFO stands for First-In, First-Out.
This symbol ensures products move through the process in the order they were produced.
FIFO lanes reduce aging inventory and improve consistency.
Relevant Subsection: Material Flow Symbols
Material flow symbols focus on physical movement throughout the value stream.
Examples include:
- Transportation arrows
- Inventory triangles
- Trucks
- Shipping docks
- Warehouses
Analyzing these symbols helps identify:
- Excess movement
- Waiting time
- Transportation waste
- Inventory buildup
Reducing unnecessary movement often produces significant efficiency improvements.
Relevant Subsection: Information Flow Symbols
Information flow is equally important in Lean manufacturing.
Common information symbols include:
- Production scheduling
- Electronic communication
- Manual communication
- Kanban cards
- Forecast signals
Poor information flow frequently causes:
- Delays
- Overproduction
- Miscommunication
- Scheduling errors
A well-designed value stream map clearly separates information flow from material flow.
Relevant Subsection: Timeline Symbols
Most value stream maps include a timeline at the bottom.
The timeline measures:
- Value-added time
- Non-value-added time
- Waiting periods
- Total lead time
This section often reveals that only a small percentage of total production time actually adds customer value.
Common Uses and Applications
VSM symbols are used across numerous industries.
Manufacturing
Factories use value stream mapping to:
- Reduce waste
- Improve productivity
- Optimize inventory
- Shorten lead times
Healthcare
Hospitals map patient journeys to improve:
- Admission processes
- Laboratory testing
- Emergency care
- Patient discharge
Software Development
Development teams use VSM to analyze:
- Coding
- Testing
- Deployment
- Release cycles
Supply Chain Management
Organizations optimize:
- Transportation
- Warehousing
- Procurement
- Distribution
Business Operations
Service companies use VSM to improve:
- Customer support
- Financial services
- Administrative workflows
- Human resources
Symbolism, Significance, or Importance
VSM symbols represent much more than simple diagrams.
Their symbolic significance includes:
- Process transparency
- Standardized communication
- Continuous improvement
- Lean thinking
- Waste identification
- Team collaboration
- Better decision-making
Unlike artistic icons or decorative symbols, VSM symbols focus entirely on operational clarity.
Their standardized visual representation enables organizations worldwide to communicate process information efficiently.
How to Use VSM Symbols
Creating a value stream map involves several straightforward steps.
Define the Process
Choose one product family or service process to analyze.
Avoid mapping multiple unrelated workflows simultaneously.
Identify Process Steps
Draw process boxes for every major activity.
Include data boxes beneath each process.
Add Material Flow
Connect processes using appropriate material flow symbols.
Include inventory locations and transportation methods.
Map Information Flow
Show how schedules, customer orders, and production instructions move throughout the system.
Differentiate electronic communication from manual communication.
Complete the Timeline
Measure:
- Processing time
- Waiting time
- Lead time
Use these metrics to identify improvement opportunities.
Design the Future State
After analyzing the current map, create a future-state map that eliminates unnecessary waste and improves workflow.
Interesting Facts
- Value Stream Mapping originated within Toyota’s Lean production system.
- Many organizations discover that more than 90% of total lead time consists of waiting rather than actual processing.
- VSM symbols are recognized globally across Lean manufacturing industries.
- Digital mapping software now includes built-in libraries of standardized VSM symbols.
- Healthcare organizations increasingly use value stream mapping to improve patient care.
- Software companies apply Lean mapping principles to DevOps workflows.
- A complete value stream map often reveals improvement opportunities that traditional flowcharts fail to identify.
Common Mistakes or Misconceptions
Confusing VSM with Flowcharts
A standard flowchart shows activities.
A value stream map shows both material flow and information flow while measuring performance.
Mapping Every Tiny Detail
VSM focuses on major process steps rather than documenting every individual task.
Ignoring Data Boxes
Without process metrics, improvement opportunities become difficult to identify.
Skipping Information Flow
Many beginners map only materials while overlooking production scheduling and communication.
Creating Maps Without Team Input
The best value stream maps are created collaboratively with employees who understand the actual process.
Frequently Asked Questions
What are VSM symbols?
VSM symbols are standardized icons used in value stream mapping to represent processes, inventory, information flow, transportation, customers, suppliers, and other Lean manufacturing elements.
Why are VSM symbols important?
They provide a universal visual language that simplifies complex workflows and helps identify waste and improvement opportunities.
Are VSM symbols standardized?
Yes. Most Lean practitioners follow standardized symbols developed from the Toyota Production System, although some organizations create minor variations.
What is the difference between material flow and information flow?
Material flow represents the movement of physical products, while information flow shows how schedules, orders, and production instructions move through the organization.
What software supports VSM symbols?
Many diagramming applications, Lean management platforms, and business process mapping tools include built-in libraries of VSM symbols.
Can service industries use VSM symbols?
Absolutely. Banks, hospitals, government agencies, software companies, and logistics providers frequently use value stream mapping to improve operational efficiency.
What does the inventory triangle represent?
The triangle indicates inventory stored between processes and often highlights opportunities to reduce waste and improve flow.
Conclusion
VSM symbols form the foundation of effective value stream mapping by providing a standardized visual language for documenting processes, material movement, and information flow. Whether you’re working in manufacturing, healthcare, software development, logistics, or another industry, understanding these symbols helps uncover inefficiencies, reduce waste, and support continuous improvement.
By learning the meaning of process boxes, inventory triangles, Kanban signals, production control icons, material flow arrows, and data boxes, you can create value stream maps that accurately represent your operations and reveal opportunities for optimization. When used correctly, VSM symbols transform complex workflows into clear, actionable diagrams that drive better decision-making and long-term operational excellence.

Daniel Carter is a writer and researcher focused on symbols, their meanings, origins, and practical uses. He enjoys turning complex symbolic concepts into simple, easy-to-understand explanations for everyday readers. Through his work, Daniel explores cultural, technical, historical, and commonly used symbols, helping readers understand what they mean and where they are used.
His work includes The Complete Guide to Symbols, Understanding Symbols and Their Meanings, and A Visual Guide to Common Symbols.