
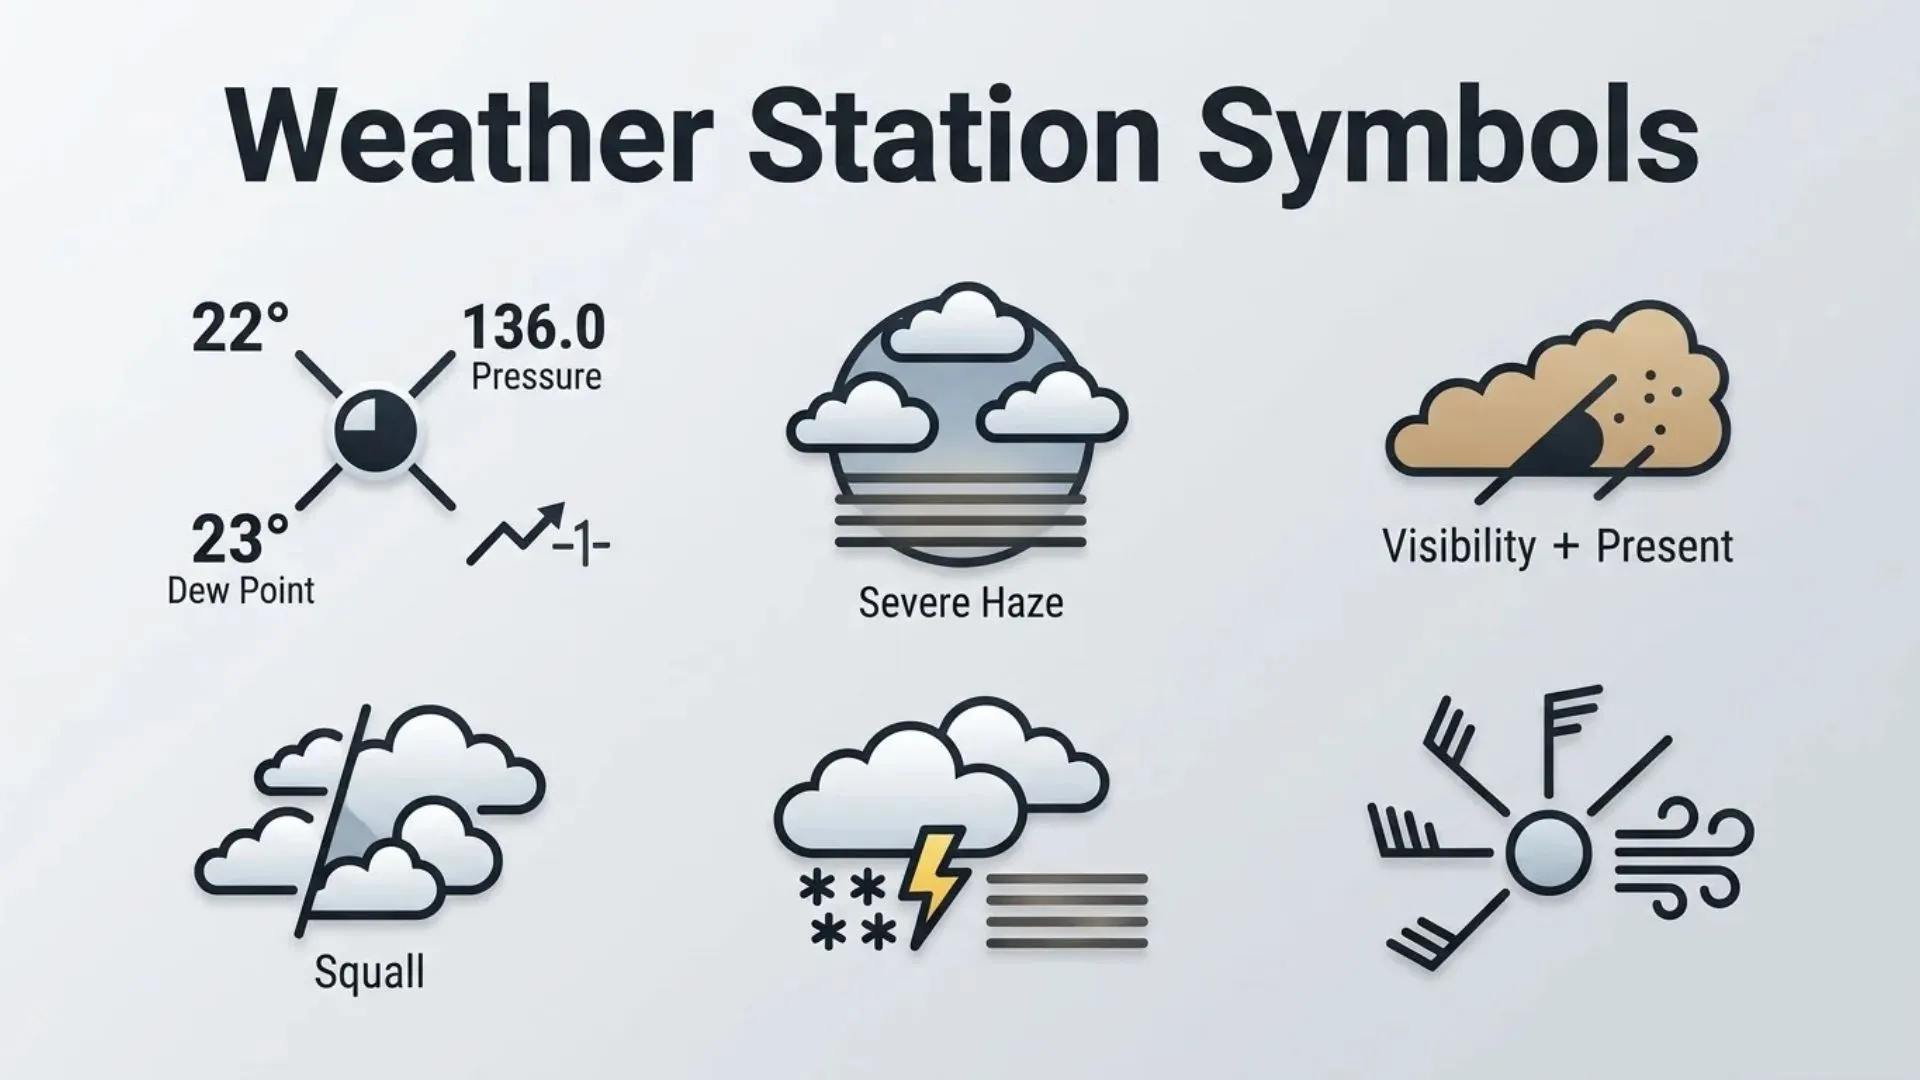
If you’ve ever looked at a weather map and noticed circles, lines, numbers, and tiny icons clustered around specific locations, you’ve encountered weather station symbols. At first glance, these symbols may seem confusing, but they are one of the most efficient ways meteorologists communicate large amounts of weather data in a compact visual format.
Weather station symbols, often displayed as part of a station model, represent current atmospheric conditions at a particular location. Instead of writing lengthy descriptions, meteorologists use standardized signs and icons to show temperature, wind speed, air pressure, cloud cover, precipitation, visibility, and many other weather variables.
Understanding these symbols is valuable for students, weather enthusiasts, pilots, sailors, emergency planners, and anyone interested in interpreting weather forecasts more accurately. This guide explains every major weather station symbol, its meaning, history, variations, and practical applications in an easy-to-understand format.
Weather Station Symbols (Meaning and Overview)
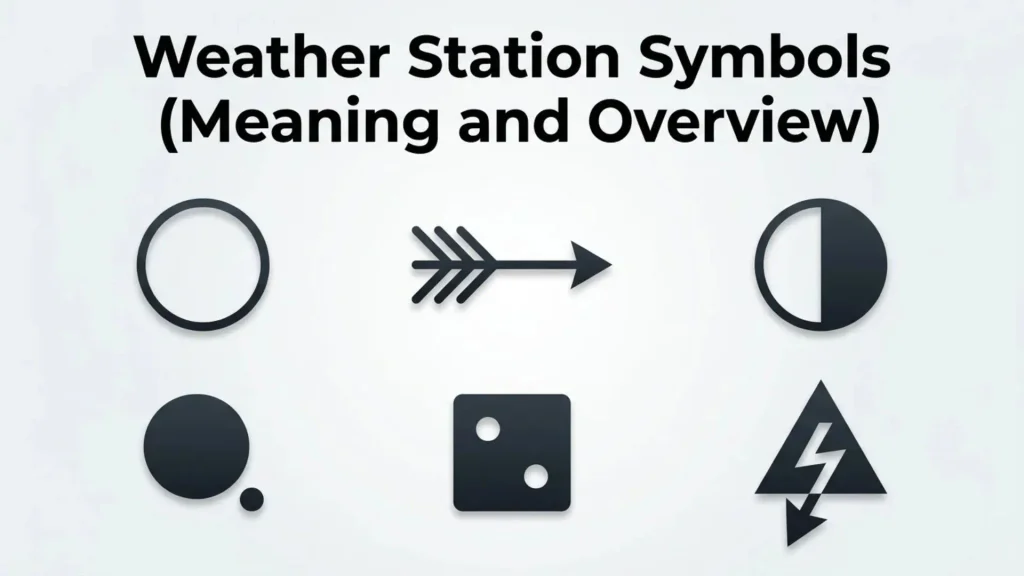
Weather station symbols are standardized graphical elements used to display multiple weather observations at a single reporting location. They serve as a universal communication system, allowing meteorologists around the world to interpret weather conditions quickly without relying on lengthy text.
A complete weather station model combines several pieces of information into one compact visual representation. Common elements include:
- Air temperature
- Dew point
- Atmospheric pressure
- Wind direction
- Wind speed
- Cloud cover
- Present weather
- Visibility
- Pressure tendency
Because these symbols follow internationally recognized standards established by meteorological organizations, weather professionals from different countries can read them regardless of language.
Weather Station Symbols (History and Origin)
The use of weather station symbols dates back to the late 19th century when national weather services began collecting observations from numerous reporting stations. As communication technology improved, meteorologists needed a faster way to display large amounts of weather information on maps.
Instead of writing complete weather reports for every location, standardized station models were developed. This compact symbolic representation made it possible to analyze weather systems across entire regions at a glance.
Today, organizations such as the World Meteorological Organization (WMO) continue to maintain standards for weather observations and symbol usage. Although modern digital forecasting systems process enormous amounts of data automatically, weather station symbols remain essential tools in meteorology education, forecasting, aviation, and climate research.
Types of Weather Station Symbols
Temperature Symbols
Temperature is one of the most important values shown on a station model.
It is typically displayed in the upper-left corner of the station symbol and represents the current air temperature at the observation site.
Depending on the country, temperatures may be shown in:
- Degrees Celsius (°C)
- Degrees Fahrenheit (°F)
This numerical value helps meteorologists identify warm and cold air masses.
Dew Point Symbols
The dew point appears in the lower-left corner of the station model.
It indicates the temperature at which air becomes saturated with moisture.
A dew point close to the actual air temperature usually means:
- High humidity
- Increased chance of fog
- Greater likelihood of rain
Lower dew points generally indicate dry air.
Atmospheric Pressure Symbols
Atmospheric pressure is displayed in abbreviated form near the upper-right section of the station model.
Meteorologists use these values to identify:
- High-pressure systems
- Low-pressure systems
- Developing storms
- Weather fronts
Pressure readings are often shortened to save space, requiring users to understand how to decode them correctly.
Cloud Cover Symbols
The central circle of the station model represents cloud cover.
Its appearance changes depending on how much of the sky is covered by clouds.
Clear Sky
An empty circle indicates completely clear skies.
Cloud cover: 0%
Partly Cloudy
Partially shaded circles represent varying amounts of cloud coverage.
Examples include:
- One-quarter filled
- Half filled
- Three-quarters filled
Overcast
A fully shaded circle indicates complete cloud cover.
Cloud cover: 100%
This simple visual representation allows meteorologists to assess regional cloud patterns quickly.
Wind Symbols
Wind information is shown using a line, called a wind barb, extending from the station circle.
Wind Direction
The wind barb points toward the direction from which the wind is blowing.
For example:
- A barb pointing south indicates wind coming from the south.
- A barb pointing northwest indicates wind from the northwest.
Wind Speed
Small markings attached to the wind barb indicate speed.
Standard values include:
- Half barb = 5 knots
- Full barb = 10 knots
- Pennant = 50 knots
By combining these markings, meteorologists can calculate precise wind speeds.
Present Weather Symbols
Special icons surrounding the station model indicate current weather conditions.
Common weather station symbols include:
Rain
A solid dot represents rain.
Multiple dots indicate heavier rainfall.
Snow
A snowflake-shaped symbol represents snowfall.
Additional snowflakes indicate heavier snowfall.
Drizzle
Small commas represent drizzle or light precipitation.
Fog
Three horizontal lines typically indicate fog.
Thunderstorm
A lightning bolt symbol represents thunderstorms.
Hail
Triangles or specialized weather icons indicate hail.
These standardized signs provide an instant understanding of current weather conditions.
Visibility and Weather Conditions
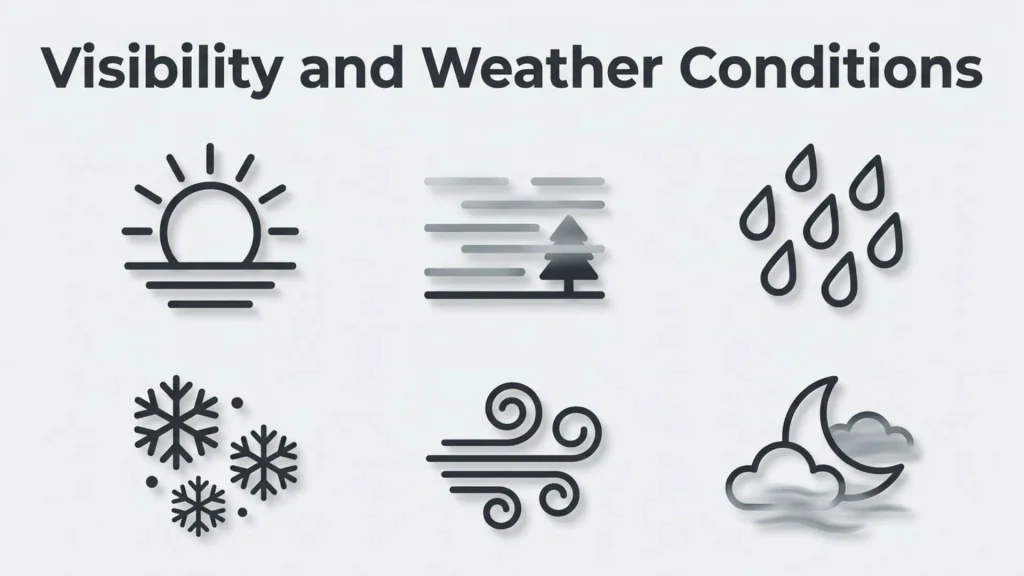
Visibility values indicate how far a person can see under current atmospheric conditions.
Poor visibility may result from:
- Fog
- Heavy rain
- Snow
- Dust
- Smoke
Visibility measurements are especially important for aviation, marine navigation, and highway safety.
Pressure Tendency Symbols
Pressure tendency shows whether atmospheric pressure has changed during the past three hours.
Small line graphs or specialized symbols indicate:
- Rising pressure
- Falling pressure
- Steady pressure
Pressure trends help meteorologists predict approaching weather systems.
Additional Weather Station Symbols
Modern weather maps may also include symbols representing:
Freezing Rain
Indicates liquid precipitation freezing on contact.
Ice Pellets
Represents sleet or frozen precipitation.
Mist
Shows reduced visibility caused by tiny water droplets.
Smoke
Indicates airborne smoke affecting visibility.
Dust Storm
Represents blowing dust reducing visibility.
Sandstorm
Used in arid regions experiencing wind-driven sand.
Tropical Storm Conditions
Special weather symbols may indicate severe tropical weather.
Common Uses and Applications
Weather station symbols serve many practical purposes beyond daily weather forecasts.
Weather Forecasting
Meteorologists analyze thousands of station models to identify developing weather patterns and forecast future conditions.
Aviation
Pilots depend on weather station symbols to evaluate:
- Wind conditions
- Visibility
- Cloud ceilings
- Storm activity
- Pressure changes
Marine Navigation
Sailors use weather station observations to monitor:
- Wind direction
- Storm development
- Sea weather conditions
Agriculture
Farmers rely on weather data to plan:
- Planting
- Irrigation
- Harvesting
- Frost protection
Emergency Management
Emergency officials monitor station models during:
- Hurricanes
- Tornado outbreaks
- Flood events
- Winter storms
Education
Teachers use weather station symbols to introduce students to meteorology and atmospheric science.
Symbolism and Significance
Weather station symbols are not decorative symbols—they are highly standardized communication tools designed for efficiency and accuracy.
Each icon carries a precise symbol meaning that allows trained observers to interpret weather conditions within seconds.
Unlike ordinary text symbols or typography symbols, these graphical elements represent real-time atmospheric measurements rather than written language.
Their symbolic significance lies in transforming complex scientific observations into a simple visual representation that can be understood worldwide.
Because they follow international standards, weather station symbols eliminate language barriers and improve communication among meteorologists, researchers, pilots, and emergency responders.
How to Read Weather Station Symbols
Learning to interpret a station model becomes much easier once you understand the layout.
Step 1: Examine the Central Circle
Check the amount of shading to determine cloud cover.
Step 2: Read the Temperature
Look at the upper-left number.
Step 3: Read the Dew Point
Find the lower-left value.
Step 4: Analyze Wind
Observe the direction of the wind barb and count the attached feathers to determine wind speed.
Step 5: Check Air Pressure
Read the abbreviated pressure value in the upper-right corner.
Step 6: Identify Present Weather
Look for nearby weather icons representing rain, snow, fog, thunderstorms, or other conditions.
By practicing with real weather maps, you’ll quickly become comfortable reading station models.
Interesting Facts
- A single weather station model can display more than ten different weather observations simultaneously.
- Wind speeds on station models are measured in knots rather than miles per hour in many professional forecasting systems.
- The World Meteorological Organization standardizes many weather observation practices worldwide.
- Modern weather satellites complement—but do not replace—surface weather station observations.
- Thousands of automated weather stations transmit observations every hour.
- Weather station symbols are widely used in aviation weather briefings.
- Some weather apps simplify station models for general audiences while professionals continue using the traditional format.
- Weather station models have remained remarkably consistent for decades because of their efficiency.
Common Mistakes or Misconceptions
Assuming Every Circle Represents the Same Weather
The amount of shading inside the station circle changes to represent cloud coverage, not temperature or precipitation.
Confusing Wind Direction
The wind barb points toward the direction the wind comes from—not where it is going.
Misreading Pressure Values
Atmospheric pressure is abbreviated on station models and must be decoded correctly.
Ignoring Present Weather Symbols
Rain, snow, fog, and thunderstorms are shown using separate icons outside the central station circle.
Believing Weather Station Symbols Are Outdated
Despite advances in digital forecasting, professional meteorologists continue using station models because they provide a compact summary of current weather conditions.
Frequently Asked Questions
What are weather station symbols?
Weather station symbols are standardized icons and numerical values that display weather observations such as temperature, wind, pressure, humidity, cloud cover, and precipitation at a specific location.
What does the filled circle on a weather station model mean?
The amount of shading indicates cloud cover. A fully shaded circle represents overcast skies, while an empty circle means clear conditions.
How do you read wind symbols on a weather station?
The wind barb points toward the direction the wind is coming from, while feathers attached to the barb indicate wind speed in knots.
Why are weather station symbols important?
They allow meteorologists to analyze large amounts of weather data quickly and accurately using a standardized visual format.
Are weather station symbols the same worldwide?
Most professional weather station symbols follow international standards, although minor regional differences may exist.
What do the numbers on a station model represent?
The numbers typically indicate air temperature, dew point, atmospheric pressure, visibility, and other meteorological measurements.
Can beginners learn to read weather station symbols?
Yes. Once you understand the basic layout and the purpose of each symbol, interpreting a weather station model becomes straightforward with practice.
Conclusion
Weather station symbols are an essential part of modern meteorology, providing a compact and universally recognized way to communicate current atmospheric conditions. From cloud cover and wind speed to temperature, air pressure, and precipitation, every symbol plays a specific role in helping meteorologists, pilots, emergency managers, and weather enthusiasts interpret the atmosphere quickly and accurately.
Learning how to read these symbols not only improves your understanding of weather forecasts but also gives you a deeper appreciation of the science behind forecasting. Whether you’re studying meteorology, planning outdoor activities, or simply curious about weather maps, mastering weather station symbols is a valuable skill that enhances your ability to interpret changing weather conditions with confidence.

Ryan Mitchell is an independent writer with a strong interest in symbols, visual communication, and the meanings behind different signs and icons. His writing focuses on providing clear, accurate, and useful information that helps readers quickly understand unfamiliar symbols. Ethan covers a wide range of topics, from everyday and cultural symbols to technical and professional symbol systems.
His books include The World of Symbols, Symbols Explained Simply, and The Essential Symbol Reference Guide.